

Note: I am new to the field of Data Analysis starting with the Candy Hierarchy Dataset. With the help of this data cleaning walkthrough, I am trying to work on data sets available online for free and using my website to document my process. I am not a professional, so if you find any mistakes or better code snippets, do share them with me in the comments section.
Language: Python
Packages Used: Pandas, Fuzzy Wuzzy, Numpy, country_list
Coding Application: Jupyter Notebooks and then moved on to PyCharm
Let’s get on with this data cleaning walkthrough right away. Here is the link to the dataset, in case you guys want it.
To start this off, in many of the examples and the tutorials I have seen, they always advise us to get to know the data at hand, become familiar with it. It makes perfect sense to me and so I am going to start finding out the intricate details about this dataset.
Let’s import the file using Pandas and display he first five rows of the dataset. Here is the code for it:
import pandas as pd

df=pd.read_csv("candyhierarchy2017.csv", encoding = "ISO-8859-1")
print (df.head())
Right off the bat, you would notice a slight difference when compared to the code normally present on other websites. The change is that I have included the encoding attribute in the read_csv() function.
read_csv takes an encoding option to deal with files in different formats. The link I checked out recommended, encoding = "ISO-8859-1" and that works for me. Alternatively, many others use encoding = "utf-8". This is generally used to convert utf-8 for to_csv
Source: Stack Overflow
In this post you will find
Contents of the Dataset:
In this Candy Hierarchy 2017 dataset the variables present are:
Internal_ID: This contains a unique identifier to every record in the database and naturally will be set to become the index of this dataset.
Going Out?: Binary field, but we can see that there are a lot of missing values.
Gender: It has four different options, but then again we have missing values as well.
Age: Numerical field, along with missing values
Country: Text Field, but users have written their own version of the names. Example, for America, there are entries such as USA, us, US, America.
State/Province: Text Field, but users have written their own version of the names. Same as the country data.
Joy Or Despair: All kinds of chocolate bars are the questions with three distinct options to choose from (Joy, Meh, Despair).
Joy Other: Text Field. Lots of missing values.
Despair Other: Text Field. Lots of missing values.
Other Comments: Text Field. Lots of missing values.
Dress: Binary field. Missing values present
Unnamed: 113
Day: Binary Answer Field. Missing values present
Media: Images and click coordinates are specified.
First Intuitions after looking at the dataset:
If we had a question or a problem we are trying to solve with the dataset then I am pretty sure we can eradicate most of the attributes in play such as the dress, day and media, and even ‘other comments’ as well irrespective of the problem at hand. But since we are only concerned with data cleaning we shall process all the attributes.
It will interesting to standardize the country and states data as there are a lot of combinations that we need to consider. Also, as a whole, the problem involving a whole host of missing values is still present.
The first thing you should really do for any datatset is go ahead and remove any column that says ‘Unnamed’. As you would have seen in the list of columns above, there is a column named ‘Unnamed: 113’. Thse type of columns are literally of no use to us even if they contains lots of values as we do not know what those values are for.
Now let us tackle all these problems one by one.
Handling Missing Data:
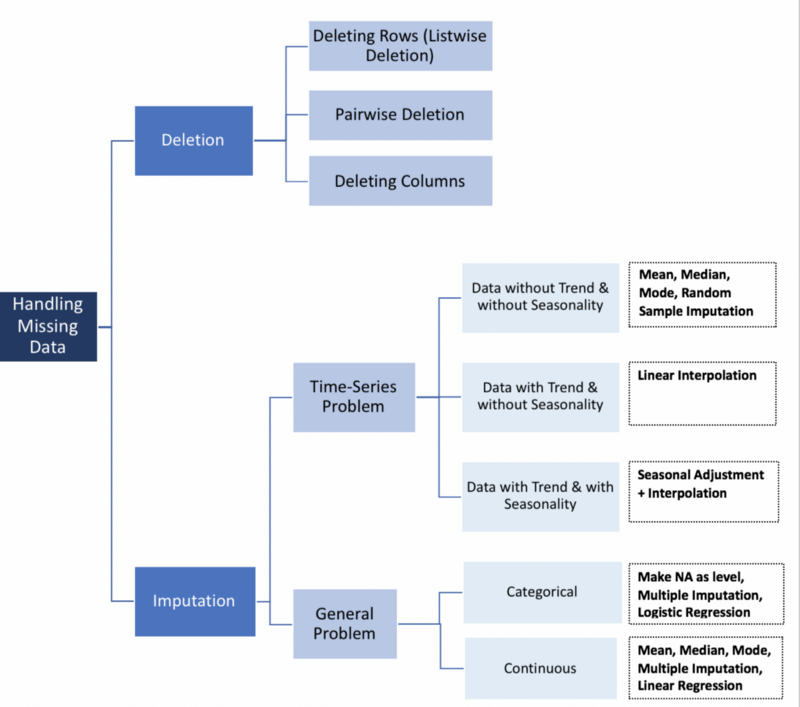
Source: Towards Data Science
Deleting ‘Unnamed’ Columns From Dataset:
df=df.drop(['Unnamed: 113'], axis=1)
Pandas offer a method to directly delete any column from the dataset. Here is the code for that:
You need to assign the code to the same data frame again because the methods in Pandas like drop() makes the changes on a copy of the data frame, so that copy needs to be reassigned to the data frame for us to use it in future computations.
If you don’t feel like to assign it to the same variable or don’t like writing extra code, you can use the variable ‘inplace’ and the value for that will be True. For example,
df.drop(['Unnamed: 113'], axis=1, inplace=True)
‘Axis’ is used to specify whether the row or column should be deleted. If the axis is 0 it denotes rows and if the axis is 1 then it denotes columns. By default, the method takes axis value to be 0.
So now we have deleted the unnamed row. Let’s move on to cleaning other parts of our data.
Removing Columns with a high percentage of NaN values in the Candy Hierarchy Dataset:
Columns that have a high number of NaN (Not a Number or NULL) values are not suitable for any sort of analysis. In case of some missing values, we can try to fill them up using one of the many ways which we shall talk about later in this walkthrough.
If you decide to go ahead with the analysis based on such attributes then the analysis will be wayward and not accurate. So it is better to avoid them or if the column is a vital part of the analysis then it is better to wait and collect more information until we have enough to perform an analysis. Or use any prediction method to fill up those fields.
One important thing to note is that one should never drop all the NaN values across all the columns from the dataset as that would lead to an incorrect analysis in case of a big percentage of missing values. Rather just drop columns with high % of NaN values.
Point to remember
Among the columns on show for us today, we need to find out the columns with more number of NaN values. Then we need to decide if those columns are really vital to our predictions and then decide whether to drop them or not.
The Industry standard percentage for dropping columns plagued with missing values is 25%-30% and can go up to ~50%. But since we are concerned with data cleaning, I am going to up those numbers and delete columns with ~70% missing values. We have 2460 records in our dataset, we reduce it by 1 to not consider the header fo the dataset. So we have 2459 records. So 70%(2459) is 1721.30. So we will now delete any column that has more than 1844 missing values.
So, here is the code to find out the number of NaN values each column has:
df.isna().sum()
After running this code we now know that the columns Media[Yahoo], Media[ESPN], Media[Daily Dish], Despair Other and Other Comments are the ones with more than 70% missing values. Now, we shall drop all those attributes by using the same drop() method. Here is the code to drop multiple columns based on the labels.
df=df.drop(['Unnamed: 113', 'Q8: DESPAIR OTHER','Q9: OTHER COMMENTS','Q12: MEDIA [Yahoo]', 'Q12: MEDIA [Daily Dish]','Q12: MEDIA [ESPN]'], axis=1)
I have done enough of dropping with this dataset, lets now move on to standardizing the other fields with missing values.
Cleaning ‘Gender’ Column in the Candy Hierarchy Dataset :
Using the isna() function we can figure out the number of null values in this column in the candy hierarchy dataset.
print (df['Q2: GENDER'].isna().value_counts())
We can see that there are 41 TRUE values which means that there are 41 records that do not have any gender specified. This may be due to loss of data or the gender field not made a compulsory field in the form that people fill out. Could be anything, literally.
We can sort of guess the gender of these 41 records by using various classification methods and examples. In any other dataset, it would make sense to predict the gender but in this dataset, we have two extra options, ‘I’d rather not say’ and ‘Other’. The latter should be a separate category in regards to transgender people. But the option ‘I’d rather not say’ is very enticing here. Since we are dealing with missing values, and there is a possibility that people did not want to give this information. So filling up the NaN values with this value makes good sense as this could possibly mean that and vice versa.
Here is the code to replace NaN with “I’d rather not say”:
df['Q2: GENDER'].fillna(value="I'd rather not say", inplace=True)
Now all the values in the Gender column are filled with no missing values.
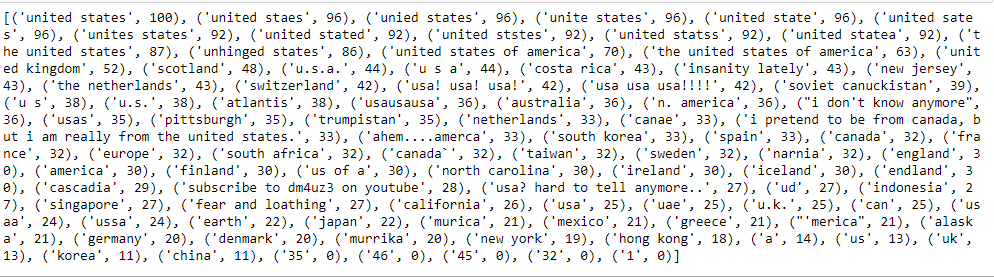
Cleaning Country Column in the Candy Hierarchy Dataset :
The mess in which the country column is in is a common case when it comes to data cleaning. The country names do not follow any set standards since the data is collected via a form and the country field is to be typed in or written in.
If you look at the values, just for mentioning the country USA, people have used more than 25 different ways. For example, people have written USA! USA! USA! , united states, US of A, United states, united States, etc.
I am going to copy the content of the file to a copy data frame so that the data will be safe even if I mess this up.
df_change=df.copy()
Normally since this data is collected with the help of a form, the data was manually coded into the database and that leads to human errors such as trailing white spaces and the use of capital letters at unwanted places. Eradicating these alone could clean up 60% of the data in most cases. Here is the code:
df_change['Q4: COUNTRY']=df_change['Q4: COUNTRY'].str.lower()
df_change['Q4: COUNTRY']=df_change['Q4: COUNTRY'].str.strip()
The deleting of trailing whitespaces did no good for our dataset. Literally, nothing got cleaned. So it is time to put on our thinking caps.
Working with Fuzzywuzzy:
To solve this discrepancy we need a function that could figure out the most common irregularities with the target word and replace it with the standardized one. Fortunately, there is a package in python that does exactly that is called Fuzzywuzzy. It is a package created by SeatGeek to solve their problem of duplicate event listings.
pip install fuzzywuzzy
With the help of fuzzywuzzy, we can figure out the values close to the target text and then replace the irregularities with the target text. To do that, there is an attribute called process which has the function extract() which helps in comparing the text with the target text. Here is the code of that:
matches = fz.process.extract(string_to_match, messy_strings,
limit=20, scorer=fz.fuzz.token_sort_ratio)
string_to_match is the target text and messy_strings is the list of strings that needs to be compared with the target. The best part of this function is that it gives an integer ratio of the closeness between the correct text and the target text. We can use the ratio in imaginative ways. The output will look like this:
matches = fz.process.extract("united states", country_unique, limit=100, scorer=fz.fuzz.token_sort_ratio)
Since we have a good idea to start off we can come up with a function to use the fuzzywuzzy attributes. Here is the function:
def replace_matches_in_column(df2, column, string_to_match, min_ratio, value_change):
    # get a list of unique strings
    strings = df2[column].unique()

    # get the top 10 closest matches to our input string
    matches = fz.process.extract(string_to_match, strings,
                                         limit=20, scorer=fz.fuzz.token_sort_ratio)

    # only get matches with a ratio > the user specified ratio
    close_matches = [matches[0] for matches in matches if matches[1] >= min_ratio]

    # get the rows of all the close matches in our dataframe
    rows_with_matches = df2[column].isin(close_matches)

    # replace all rows with close matches with the input matches
    df2.loc[rows_with_matches, column] = value_change
df2 is the data frame, column is which attribute to focus on, string_to_match are the unique values in the column, min_ratio is the lowest threshold ratio above which the values must be changed and value_change is the value to replace the irregular text.
Once this is done, the final country column will be cleaned close to 90%. Now there are a few states that are mentioned in the country column and text like ‘I pretend to be from Canada’, ‘I don’t know anymore’. You can drop those rows as they do no offer much since without these rows we have close to 95% of our data. To drop:
if instance not in list_countries:
         df_change=df_change[df_change['Q4: COUNTRY']!=instance]
instance is each of the irregular text. I am checking to see if they are present in the list of countries and if not then they are discarded. That brings an end to the cleaning of the country column. Let’s move on to the other columns.
Cleaning the Age Column:
Let us first check to see if this column has any missing data or null values.
age_list.isna().sum()
We can see that there are 80 null values in the column and that needs to be filled. We can drop these 80 rows but then we would have inconsistent data so it is always better to fill them either using the fillna() method or by imputation.
Before we go about filling the values we first need to see if the age column contains any text data. To check for that,
age_list.value_counts()
There are a few text data in the candy hierarchy dataset, but more than 90% of the data seems to be numerical. We are all convinced that the age column should be a numerical one as it serves many purposes. As long as more than 55% of the age data is text, or they wanted the age data to be in text form, we need to deviate from our approach but in this current scenario, we will make age a numerical field.
What does fz represent in the, working with fuzzywuzzy part. Did you import fuzzywuzzy as fz?